EMAT 6680
Assignment 2
By Stephen Morgan
Assignment 2 Prompt:
Assignment 2 Solution:
To start with this assignment I decided to best thing to do was start with a simple graph where b and c are fixed (i.e. b=1 and c=2). We will vary the value of a and note any observations.
or....
I made an animation of the graph with b and c fixed (b=1, c=2 respectively). Then I chose to let a be a variable value from -10 to 10 and made the following animation. I chose
larger values for a as well, but the same general observations were made. First off, no matter what value we let a equal, the parabola passes through the point (0, 2). I would suspect this to be true for
any value of c. That is if c was 27 or -14, it would pass through (0, 27) or (0, -14) instead. This makes sense because if we plug in 0 for x irregardless what a, b, and c are, we'll find that y=c.
So (0, C) will be a point on all parabolas regardless of the values of a or b. We will examine this algebraically!
The next observation I made is that the graph seems to have a horizontal assymptote irregardless what the value of a is. However, it is not constant. It changes as the value of a changes.
Perhaps, later we will see what. Also, the graph has a minimum for all values where a is negative and a maximum for all values where a is great then 0. We will discuss this as well.
Wait a minute though, how do we know (-b/2a, k) is the minimum or maximum value of our graph? Simple Calculus!!! If we take the derivative of the equation we get y'=2ax+b.
Solving for x we get -b/2a. This is the point where the equation switches from increasing in value to decreasing in value or vice versa. If a is greater then 0, then the equation is
decreasing to the left of (-b/2a, k) and increasing to the right of (-b/2a, k). Thismeans that here (-b/2a, k) is the minimum value of our equation. If a is less then 0, then the equation
is increasing to the left of (-b/2a, k) and decreasing to the right of (-b/2a, k), so (-b/2a, k) is the maximum value of our equation.
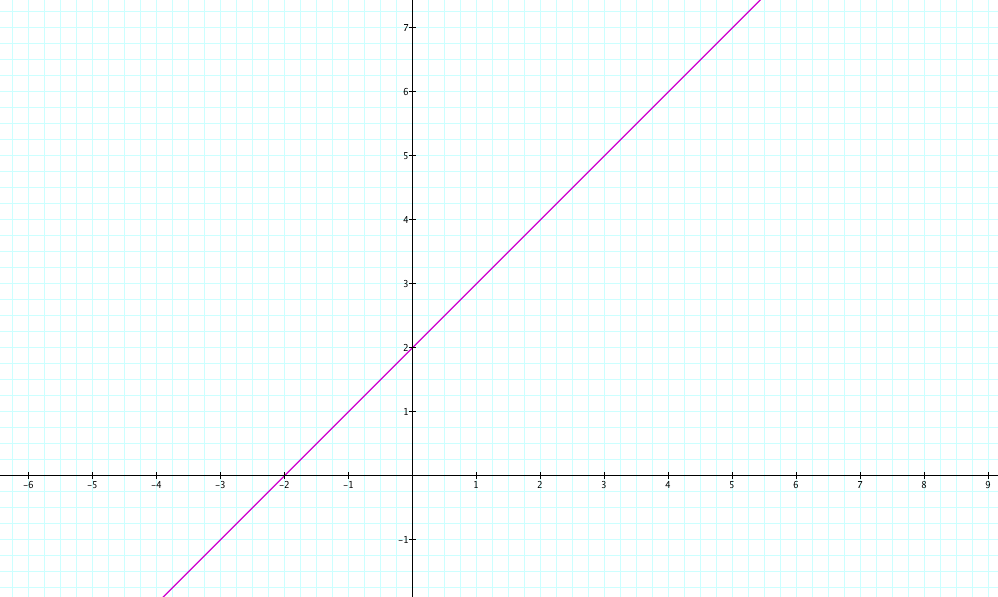
When a=0 our equation becomes y= bx+c. It is important to note here that since -b/2a is undefined the graph is of a line that has no local minimum or maxium. There is also only
one root, or value of x where y=0, so our graph resembles that of a slanted line, instead of a parabola. It is also interesting to note that this equation is always increasing or decreasing,
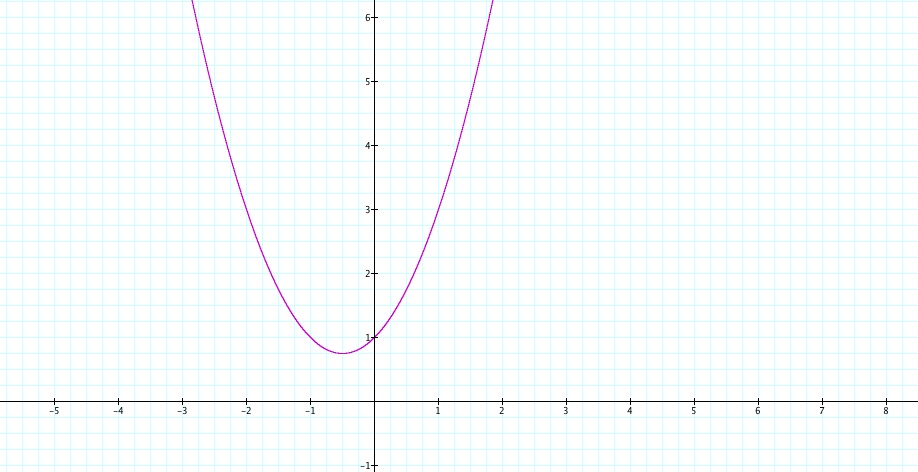
since it's derivative is a costant. Y'=b. Below is a picture of the graph where a=0, b=1, and c=2.
*This is equivalent to y= x+2
The last thing the assignment asked us to do is to interpret similiar graphs. I decided the most interesting thing to do here was to observe three different types of graphs. The first graph we
will observe (below) is where the value of a changes and b and c are fixed values. We have already done this, so let's pull up our animation where the value of a changes, b=1 and c=2. When we
do this, as mentioned earlier, we see the point (0, C) is constant in every graph. We also see if a>0 that the graph has a minimum at (-b/2a, k) and if a<0 it has a maximum at (-b/2a+k). We can verify
this by using Calculus as stated, previously.
The next situation I decided to examine was the family of graphs where a and c are fixed but b changes. If we take a=1 and c=2, we see that for values of b between -2 and 2 the
minimum value the graph is above the x and y-axis. As b becomes larger then two the graph moves to the left and the minium is below the x and y axis to the left of the origin. As b becomes
smaller then -2 the graph moves to the right and the minimum is below the x and y-axis to the right of the origin. It is also important to note that when the values of b change, we do not have a
pair of coordinates that is contained in all the families of this graph. It is also neat to see that when b is >5 or b is <-5 that the graph goes through the origin. I am not entirely sure, but I suspect
this is some how related to the golden ratio (ie (1 +/- sqrt 5 )/ 2).
The final situation I examined was the family of graphs where a and b were fixed, but the value of c changes. If we take a=1 and b=1, and change the value of c, the graph is not very interesting.
The graph moves vertically as the value of c increases and moves down vertically as the value of c decreases. Besides this, the graph appears to stay constant. The graph is merely being shifted up
and down vertically.
![]()